

![Spurr [ANCW, 148 ft]](https://www.avo.alaska.edu/ashcam-api/images/Spurr_ANCW/2026/126/Spurr_ANCW-20260507T100000Z.jpg)
![Spurr [SPCR, 3199 ft]](https://www.avo.alaska.edu/ashcam-api/images/spurr_spcr/2026/126/spurr_spcr-20260507T100100Z.jpg)
![Spurr [SPCL, 4200 ft]](https://www.avo.alaska.edu/ashcam-api/images/spurr_spcl/2026/122/spurr_spcl-20260503T053000Z.jpg)

Ash Forecasting
Mathematical models developed by the USGS forecast various aspects of how a volcanic ash plume will interact with wind—where, how high, and how fast ash particles will be transported in the atmosphere, as well as where ash will fall out and accumulate on the ground. AVO runs these models when a volcano is restless by assuming a reasonable hypothetical eruption, to provide a pre-eruptive forecast of areas likely to be affected. During an ongoing eruption, AVO will update the forecast with actual observations (eruption start time and duration, plume height) as they become available.
View the current airborne ash cloud models for Spurr
Ashfall thickness forecast
The Ash3d model was developed by the USGS to forecast how a volcanic ash plume will interact with wind and where ash will fall out and accumulate on the ground. AVO runs these models twice daily when a volcano is restless by assuming a reasonable hypothetical eruption altitude and duration. The map shows the model results of ashfall thickness for areas that are likely to be affected, if one were to occur. During an ongoing eruption, AVO will update the forecast with actual observations (eruption start time and duration, plume height) as they become available, and these plots will be automatically updated. The National Weather Service Anchorage Forecast Office will issue the official ashfall warning product and post them at weather.gov/afc
THESE PRODUCTS MAY NOT BE CURRENT.During an actual eruption, see National Weather Service forecasts of ashfall:https://weather.gov/afc.
Ashfall Forecast
Ashfall Start Time
This map shows the modeled estimate of the time it would take for ashfall to begin following an eruption. It corresponds to the ashfall thickness forecast map shown above. This map uses the start time of either the twice-daily hypothetical model runs (time shown in the legend) or the actual eruption start time (if one were to occur). In the case of an actual eruption, the National Weather Service Anchorage Forecast Office will issue the official ashfall warning product that includes the ashfall start time and post them at weather.gov/afc
THESE PRODUCTS MAY NOT BE CURRENT.During an actual eruption, see National Weather Service forecasts of ashfall:https://weather.gov/afc.
Ashfall Start Times Forecast
Ashfall likelihood maps
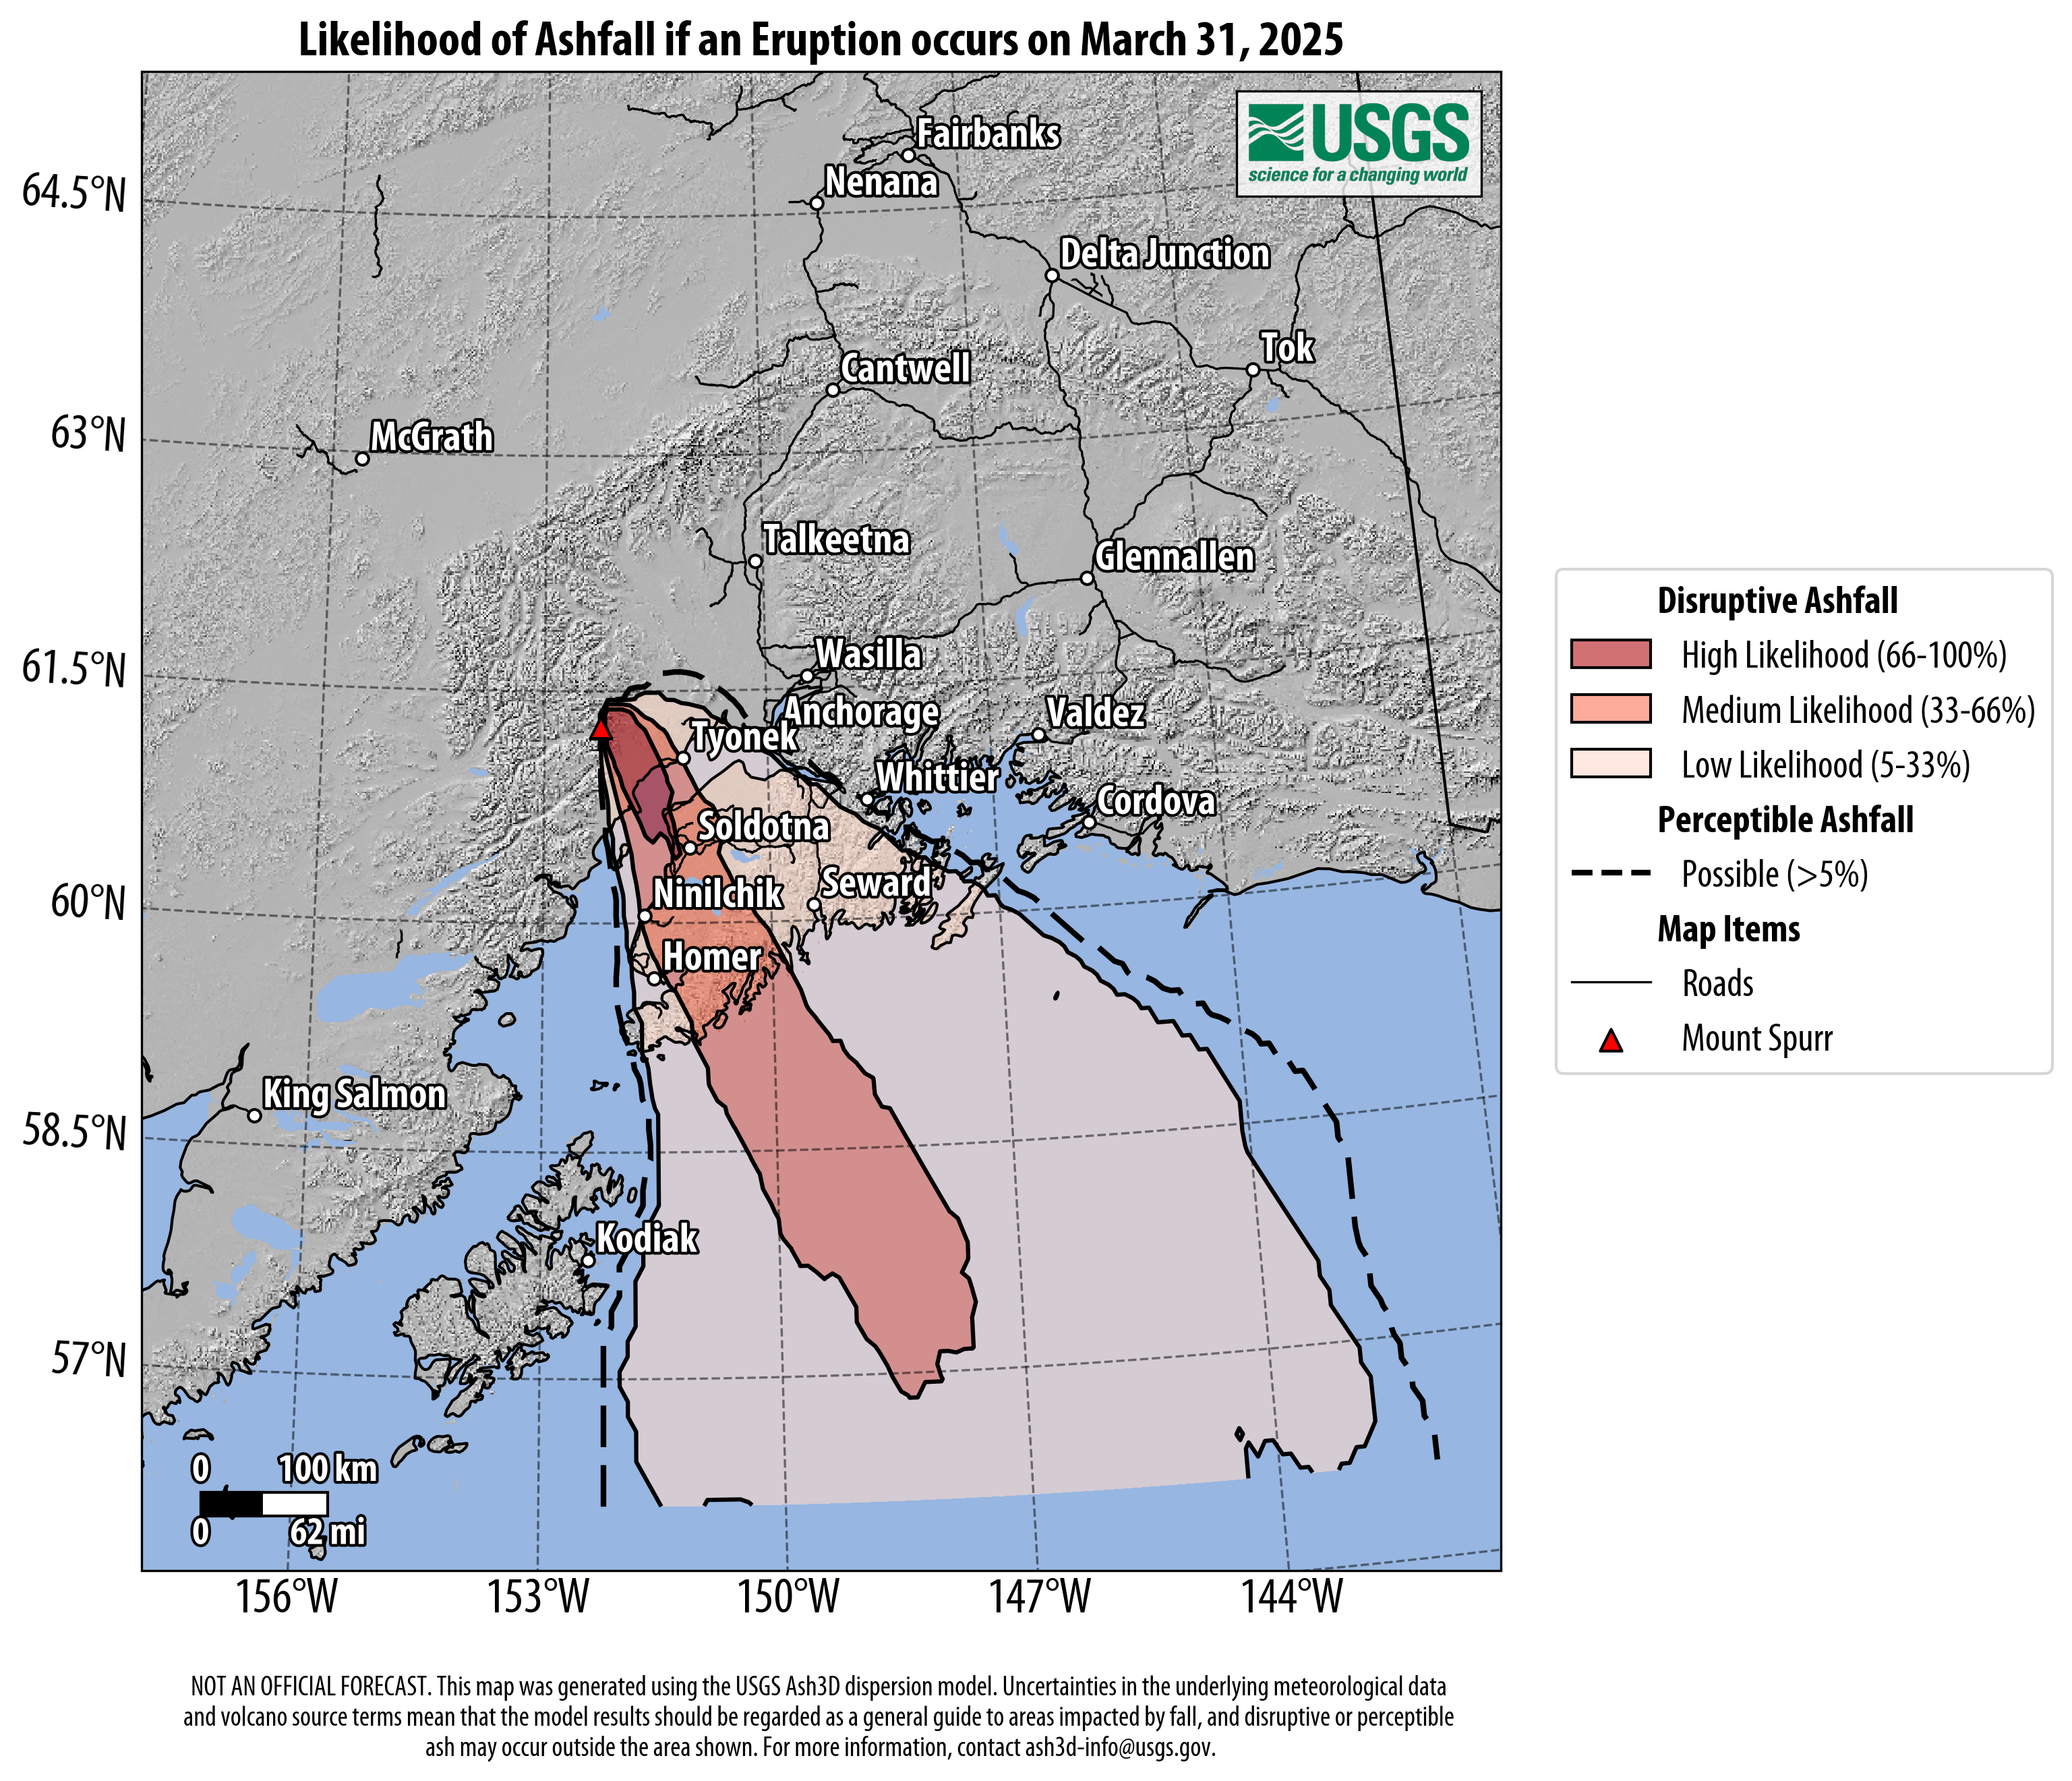
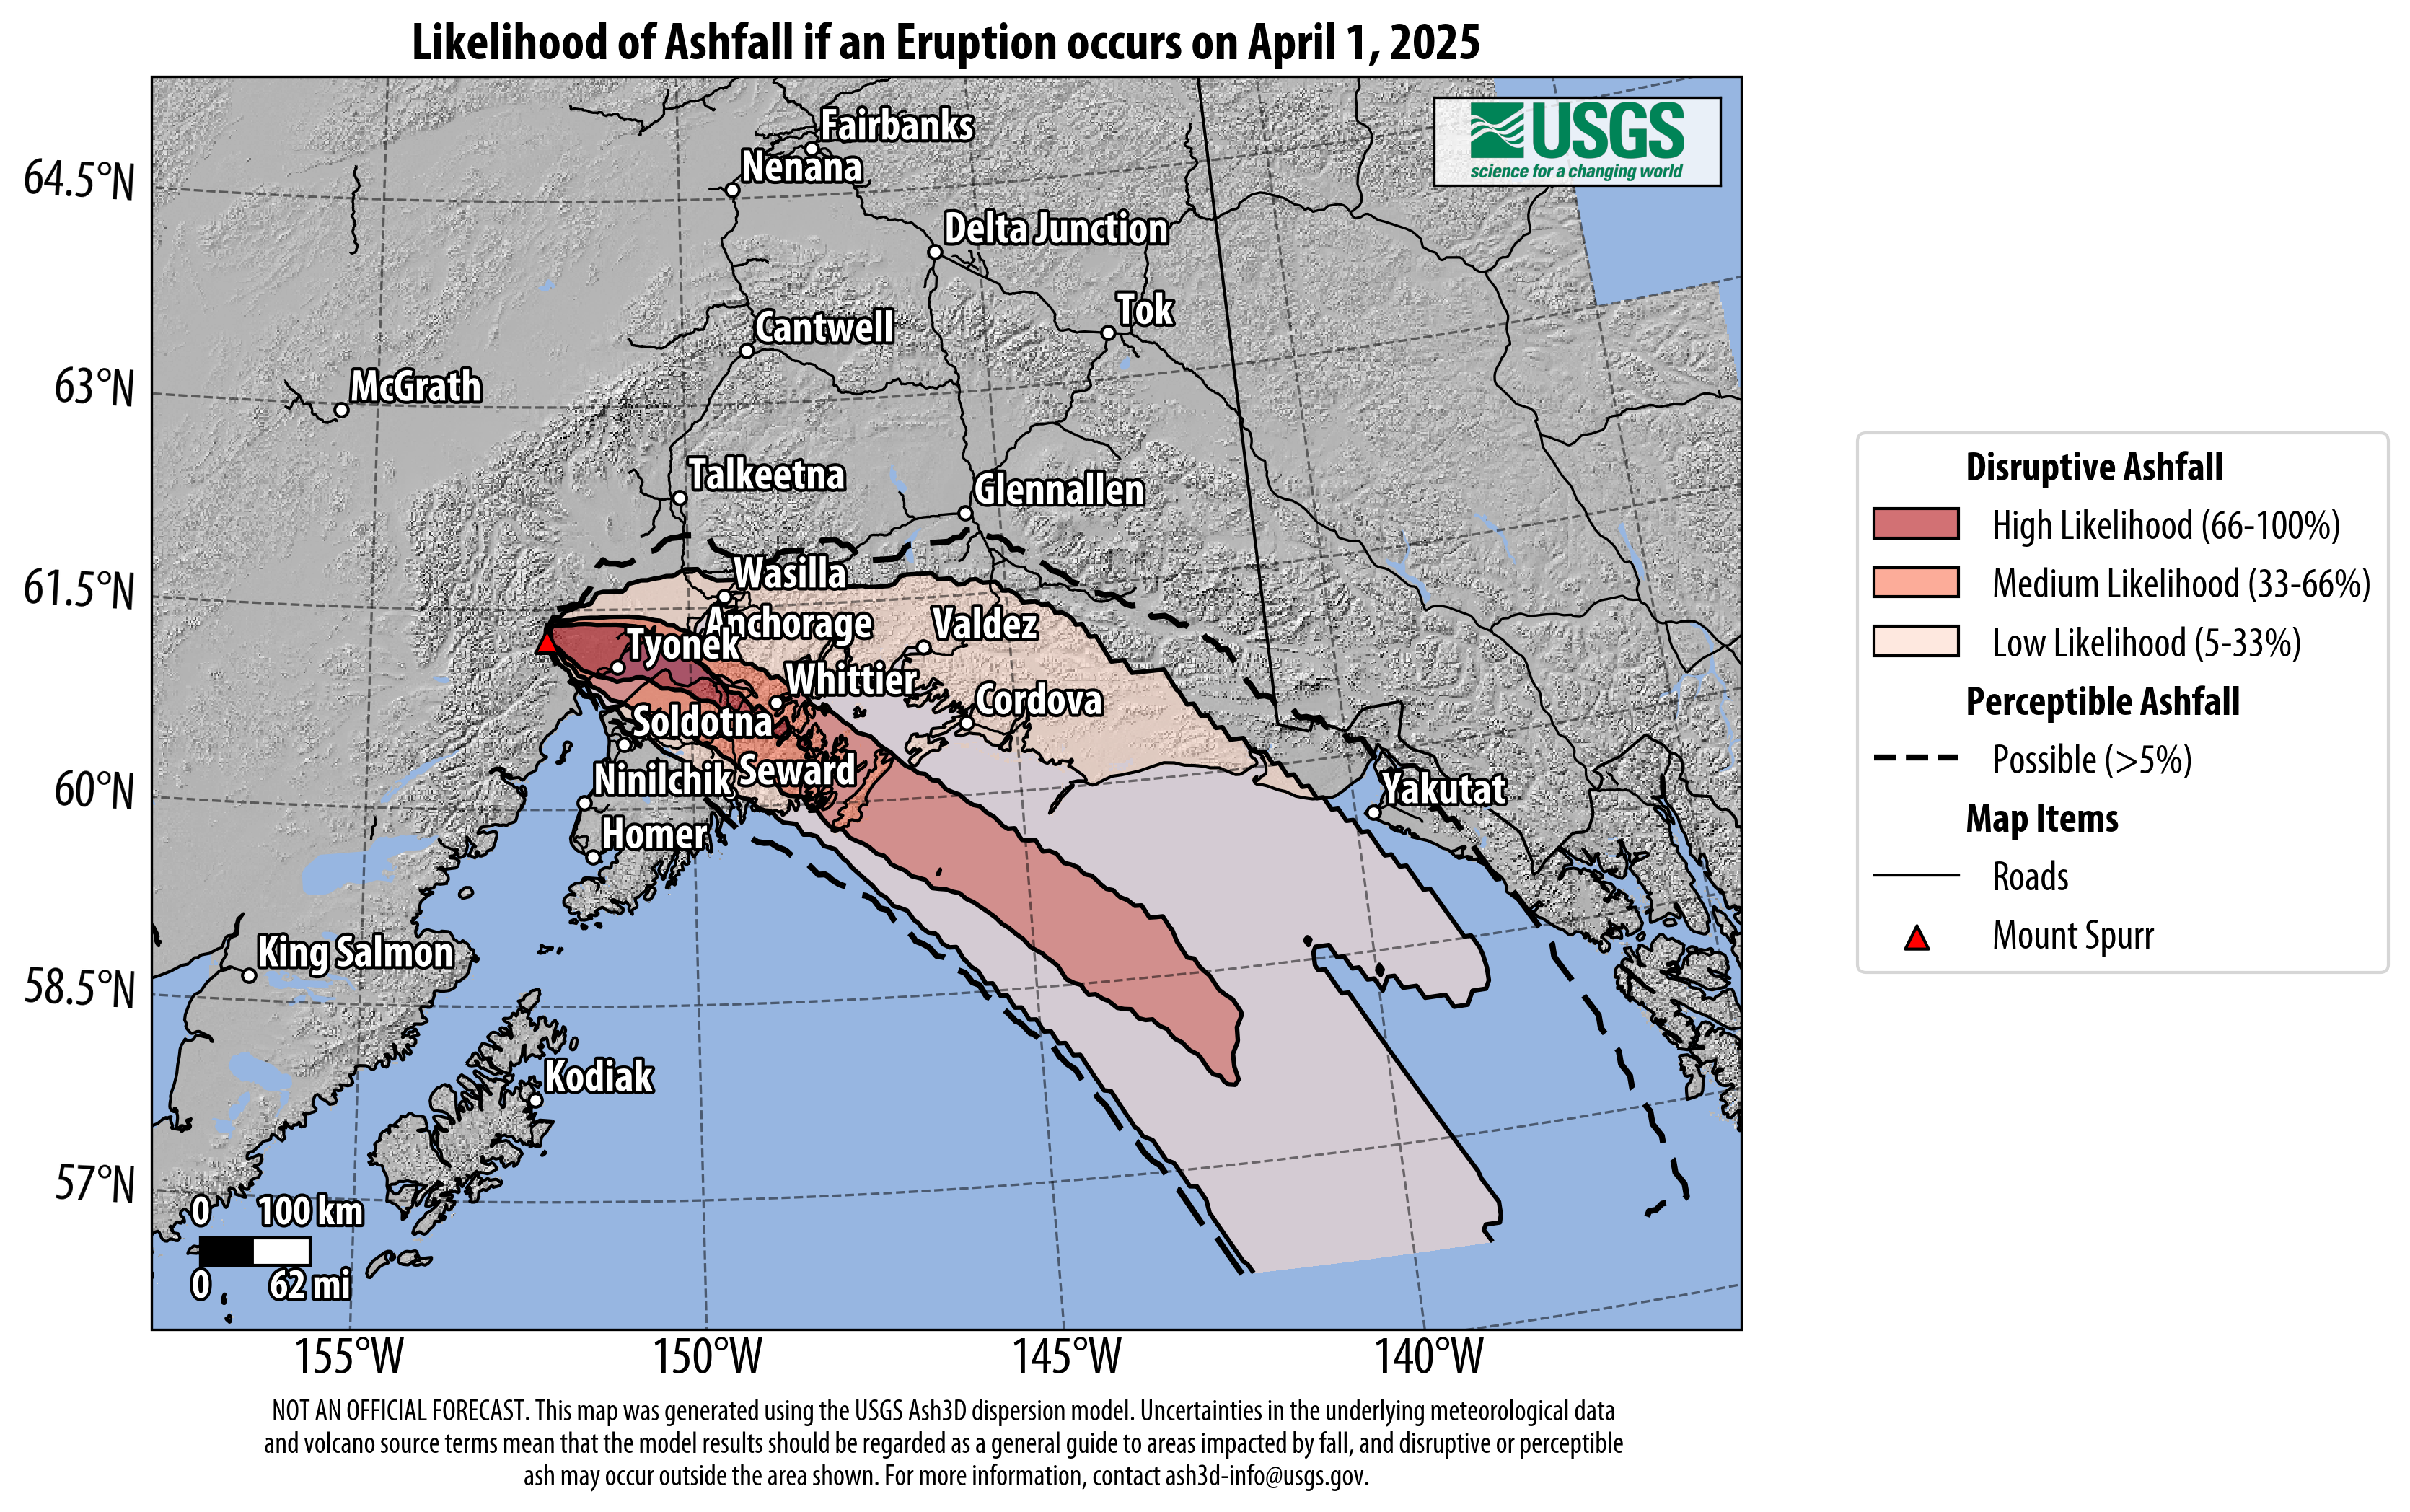
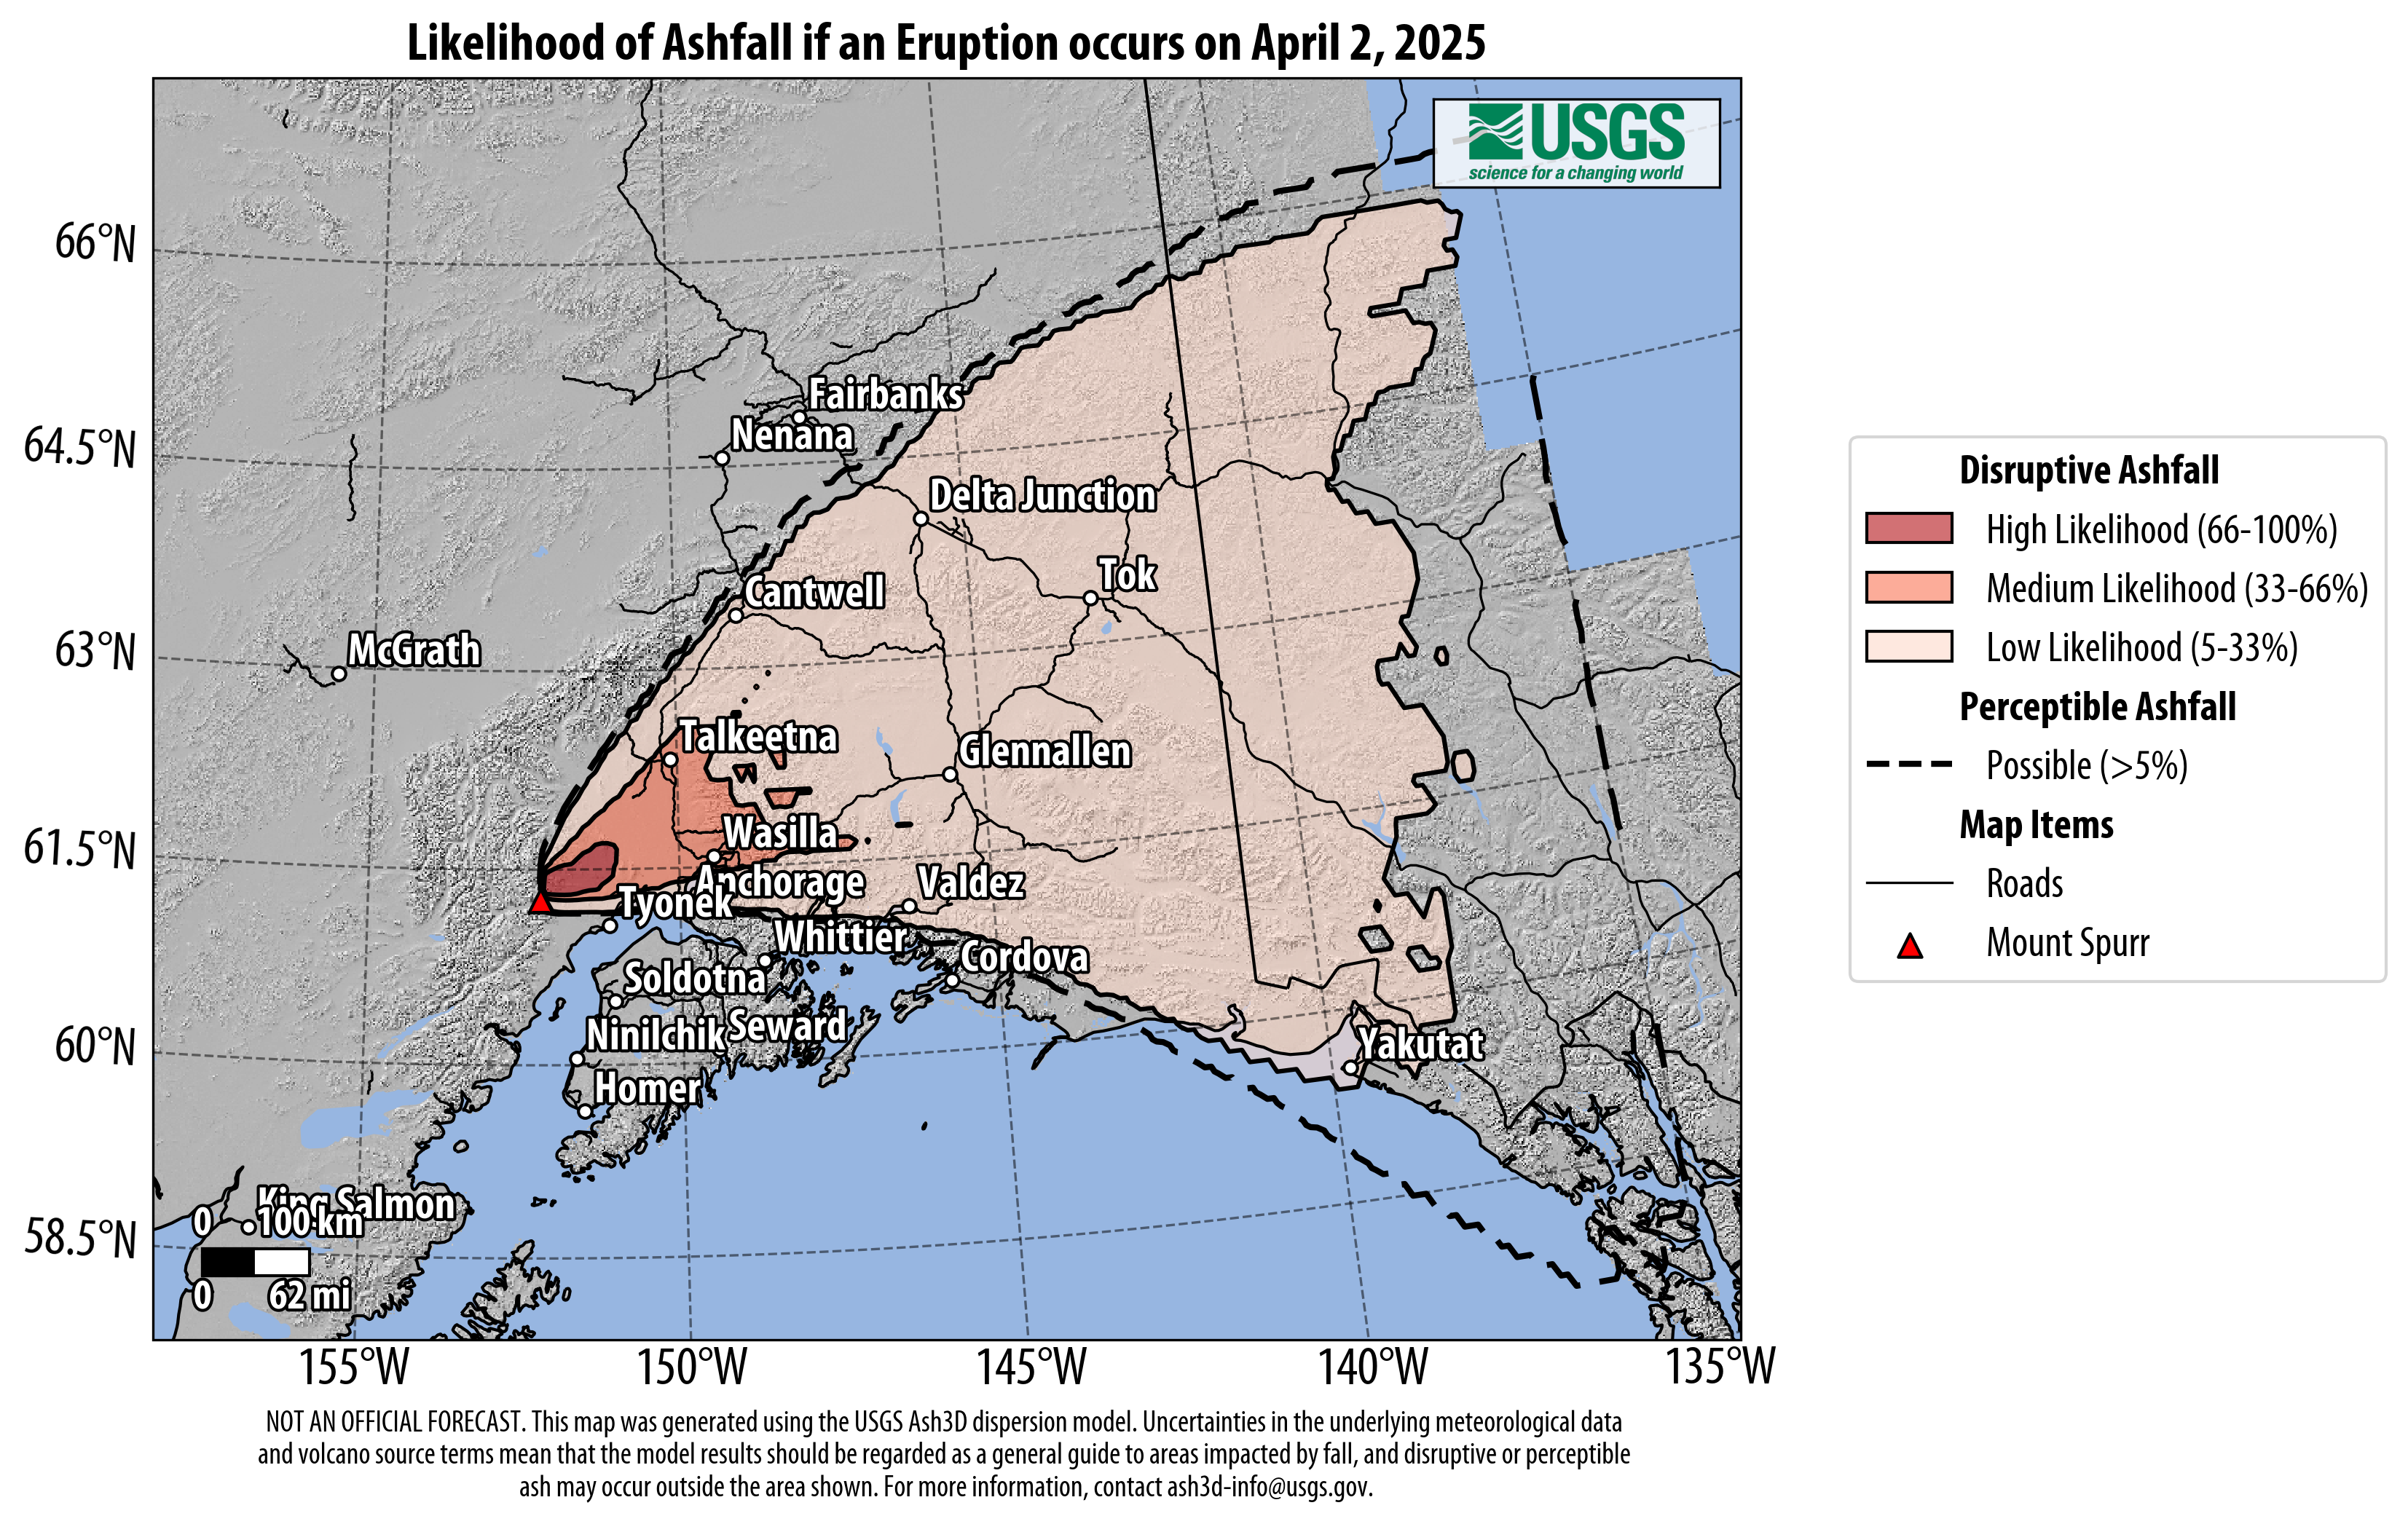
These maps show the areas that could experience ashfall if an explosive eruption of Mount Spurr were to occur. They show the area of “disruptive” ashfall where at least 100 g/m2 (0.3 oz/ft2) of ash could fall (in color), and a larger area where “perceptible” ashfall of 10 g/m2 (0.03 oz/ft2) could occur (as a dashed line).
Three ashfall likelihood maps are produced daily and provide ashfall forecasts for the current day, the next day, and two days later. These are intended to be used for situational awareness and planning purposes. Each map is based on 48 simulations using the USGS Ash3d model. The simulations vary the eruption start time and eruption cloud altitude using observations of three explosive events at Spurr in 1992 as guidance.
“High likelihood” areas are impacted in 66-100% of the simulations, “Medium Likelihood” areas are impacted in 33-66% of the simulations (25–50%); and “Low Likelihood” areas are impacted in 5-33% of the simulations.
What is the relationship between mass and deposit thickness?
The Ash3d model determines areas affected based on ashfall in units of mass per unit area (g/m2 or oz/ft2). Two ash deposits with the same mass per unit area but different densities will have different thickness: a denser ash deposit will be thinner than a less dense deposit of the same mass per unit area. We will not know the density until after an eruption starts and ashfall occurs, so a range of deposit thicknesses are given.
What can I expect from “disruptive” ash?
The “disruptive” ashfall maps show how likely it is for areas to receive at least 100 g/m2 (0.3 oz/ft2) of ash given the forecasted wind conditions. This threshold for potentially disruptive ashfall is based on case studies from around the world. A mass per unit area of 100 g/m2 corresponds to an ash deposit that is approximately 0.1 to 1 mm (0.004–0.04 inches) thick, depending on the deposit density and whether it has been compacted by rain or snow.
It is important to note that the threshold is a minimum value. The ash deposit from an actual eruption would likely be much greater closer to the volcano, and in populated areas. For example, the ash deposit in Anchorage from the August 1992 eruption of Mount Spurr was 10-20 times greater than the threshold used in the maps. Ashfall in Anchorage from the 1953 eruption was about twice that of 1992, and in both cases it was sufficient to block out the sun for several hours across Cook Inlet, turning day into “night”.
In general, the thicker the ashfall, the more problems it will cause on the ground, especially in populated areas. The 1992 ashfall closed the Anchorage airport for almost a day until it could be cleared, and presented air quality problems for months as the ash was resuspended by winds and vehicle traffic. A variety of other impacts are possible including abrasive damage to mechanical equipment, and disruptions to electrical service. Detailed information and photos of ashfall impacts and how to mitigate them is available through the Volcanic Ashfall Impacts Working Group.
What can I expect from “perceptible” ash?
The area of “perceptible” ashfall is shown on the maps using a dashed line and shows the area where 10 g/m2 (0.03 oz/ft2) of ashfall was in 5% of model runs. A mass per unit area of 10 g/m2 corresponds to an ash deposit that is at least 0.01 mm (0.0004 inches) thick, depending on the deposit density and whether it has been compacted by rain or snow. This amount of ash is noticeable to the naked eye and will be most apparent on surfaces that have a different color than the ash or are reflective and smooth, like snow or cars.