Pavlof


Facts


  • Official Name: Pavlof Volcano
  • Seismically Monitored: Yes
  • Color Code: GREEN
  • Alert Level: NORMAL
  • Elevation: 2518m (8261ft)
  • Latitude: 55.4173
  • Longitude: -161.8937
  • Smithsonian VNum: 312030
  • Pronunciation:
  • Nearby Towns:
    • Belkofski 23 mi (37 km) SW
    • King Cove 30 mi (48 km) SW
    • Cold Bay 36 mi (58 km) SW
    • Nelson Lagoon 49 mi (78 km) NE
    • Sand Point 55 mi (89 km) SE

    Distance from Anchorage: 590 mi (950 km)

  • Subfeatures:
    • Little Pavlof

Description

From Miller and others (1998) [1] : "Pavlof Volcano is a largely snow-covered, cone-shaped mountain with a high ridge extending to the southwest towards the rim of Emmons Lake Caldera. The volcano is approximately 7 km in diameter and has active vents on the north and east sides close to the summit [2] . It is situated high on the northeastern flank of Emmons Lake Caldera along a northeast-trending alignment of vents that includes Pavlof Sister, and several intracaldera cones [3] . The stratovolcano is relatively undissected and is mostly Holocene in age. Pavlof lies within the Shumagin seismic gap [4] ." The name Pavlof comes from Russian, translating to "Paul" or "Saint Paul". This volcano name was first published as "Pavlovskoi Volcan" by Captain Lutke in 1836.

Name Origin

"Pavlof Volcano" is a Russian name, meaning "Paul" or "Saint Paul," published as "Pavlovskoi Volcan" by Captain Lutke (1836), and as "Pavlovskaya Sopka" on a Russian Hydrographic Department Chart (1847) (Orth, 1971).


References Cited

[1] Catalog of the historically active volcanoes of Alaska, 1998

Miller, T. P., McGimsey, R. G., Richter, D. H., Riehle, J. R., Nye, C. J., Yount, M. E., and Dumoulin, J. A., 1998, Catalog of the historically active volcanoes of Alaska: U.S. Geological Survey Open-File Report 98-0582, 104 p.

[2] Geological and seismological evidence of increased explosivity during the 1986 eruptions of Pavlof Volcano, Alaska, 1991

McNutt, S. R., Miller, T. P., and Taber, J. J., 1991, Geological and seismological evidence of increased explosivity during the 1986 eruptions of Pavlof Volcano, Alaska: Bulletin of Volcanology, v. 53, n. 2, p. 86-98.

[3] Geology of Pavlof Volcano and vicinity, Alaska, 1955

Kennedy, G. C., and Waldron, H. H., 1955, Geology of Pavlof Volcano and vicinity, Alaska: in Investigations of Alaskan volcanoes, U.S. Geological Survey Bulletin 1028-A, 19 p., 1 sheet, scale 1:100,000.
full-text PDF 744 KB
plate 3 PDF 9.1 MB

[4] Shumagin seismic gap, alaska Peninsula: History of great earthquakes, tectonic setting, and evidence of high seismic potential, 1981

Davies, J.N., Sykes, L., House, L., and Klaus, J., 1981, Shumagin seismic gap, Alaska Peninsula: History of great earthquakes, tectonic setting, and evidence of high seismic potential: Journal of Geophysical Research, v. 86, p. 3821-3855.

Current Activity

No new updates for Pavlof volcano since January 20, 2023, 11:29 am.

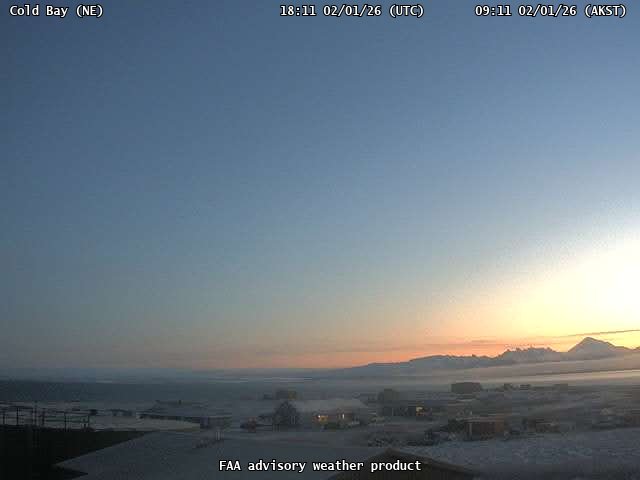
Webcams

Webicorder

Color Code Timeline

Loading Past Activity...

Loading Images...

Loading Maps...

Loading Bibliography...

Ash Forecasting

Mathematical models developed by the USGS forecast various aspects of how a volcanic ash plume will interact with wind—where, how high, and how fast ash particles will be transported in the atmosphere, as well as where ash will fall out and accumulate on the ground. AVO runs these models when a volcano is restless by assuming a reasonable hypothetical eruption, to provide a pre-eruptive forecast of areas likely to be affected. During an ongoing eruption, AVO will update the forecast with actual observations (eruption start time and duration, plume height) as they become available.

View the current airborne ash cloud models for Pavlof

Ashfall thickness forecast

The Ash3d model was developed by the USGS to forecast how a volcanic ash plume will interact with wind and where ash will fall out and accumulate on the ground. AVO runs these models twice daily when a volcano is restless by assuming a reasonable hypothetical eruption altitude and duration. The map shows the model results of ashfall thickness for areas that are likely to be affected, if one were to occur. During an ongoing eruption, AVO will update the forecast with actual observations (eruption start time and duration, plume height) as they become available, and these plots will be automatically updated. The National Weather Service Anchorage Forecast Office will issue the official ashfall warning product and post them at weather.gov/afc

THESE PRODUCTS MAY NOT BE CURRENT.

During an actual eruption, see National Weather Service forecasts of ashfall:https://weather.gov/afc.
Ashfall Forecast

Click on the X on the graphic (upper right) to expand the map to show the map legend.

Ashfall Start Time

This map shows the modeled estimate of the time it would take for ashfall to begin following an eruption. It corresponds to the ashfall thickness forecast map shown above. This map uses the start time of either the twice-daily hypothetical model runs (time shown in the legend) or the actual eruption start time (if one were to occur). In the case of an actual eruption, the National Weather Service Anchorage Forecast Office will issue the official ashfall warning product that includes the ashfall start time and post them at weather.gov/afc

THESE PRODUCTS MAY NOT BE CURRENT.

During an actual eruption, see National Weather Service forecasts of ashfall:https://weather.gov/afc.

Ashfall Start Times Forecast

Click on the X on the graphic (upper right) to expand the map to show the map legend.