Deformation
What is Deformation Monitoring?
Various processes such as plate tectonics, earthquakes, or volcanic unrest can generate changes to the ground surface. These changes can manifest as quite obvious to the naked eye, for instance the surface trace of an earthquake, or the collapse of a caldera, such as during the 2018 Kilauea eruption. Most of the time, though, these changes are more subtle. The movement of the tectonic plates, for example, happens at speeds similar to the growth of fingernails, but over much larger regions.
Related to volcanism, magma, gas, or other fluid movement can produce changes to the ground surface, such as swelling (possibly magma moving upward), sinking (magma being withdrawn from under an area), or cracking. More often than not, these changes are very small— sometimes only a centimeter—and can take place very gradually, over the course of days to months. Several technologies exist to measure such small changes, including high-precision GPS, InSAR (Interferometric Satellite Aperture Radar), or tiltmeters.
GPS has proven to be an important tool for monitoring volcanoes, as these instruments are sensitive to slow, steady magmatic recharge that otherwise could go unnoticed. In deformation monitoring, we use GPS receivers and antennas that allow much higher precision than regular hand-held devices or smartphones. These receivers record broadcast signals emitted by satellites orbiting the Earth. The recording intervals range from once every 15 seconds to 1-5 times per second. Sophisticated data analysis allows us to detect very small movements of the Earth’s crust (a few millimeters to centimeters). More information on GPS can be found here: https://volcanoes.usgs.gov/vhp/gps.html
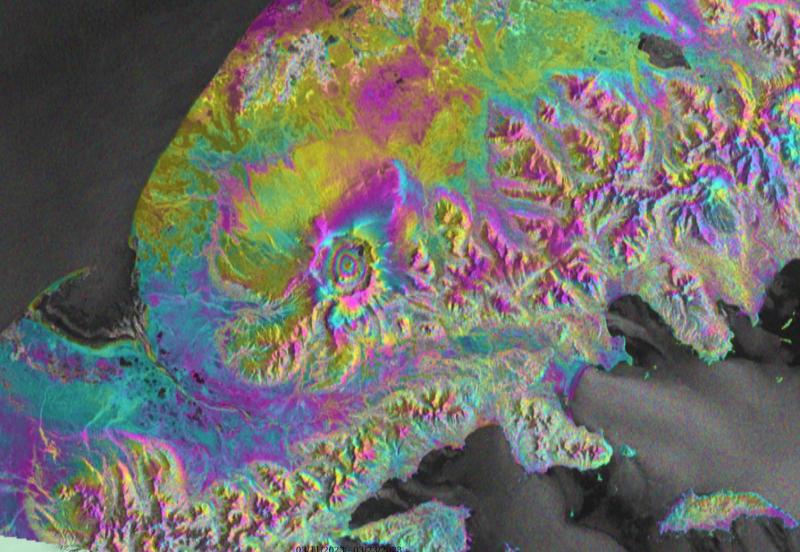
InSAR (Interferometric Synthetic Aperture Radar) is another technique commonly used to detect and understand volcanic deformation. A radar satellite sends a pulse of energy to the Earth and records the reflected signal. If a satellite repeats a measurement of the same region at a later time, we can compare the return signal and analyze whether the ground has shifted. This can help create very insightful deformation maps, but doesn’t work well in steep or snowy terrain. More information on InSAR can be found here: https://volcanoes.usgs.gov/vhp/insar.html
Tiltmeters are very sensitive instruments that measure the tilt or change in angle of a surface. Since they can measure incredibly subtle changes in tilt, these instruments are generally installed in boreholes (up to 8 m deep or so). This dampens the tilt created by daily temperature changes of the ground, due to swelling and shrinking following rain, and wind noise. In an ideal scenario, tiltmeters allow us to see deformation below the resolution capabilities of GPS and over longer time periods than seismometers easily resolve. They can fill an important niche in deformation monitoring, but their susceptibility to noise makes them also difficult to use. More information on tiltmeters can be found here: https://volcanoes.usgs.gov/vhp/tilt_strain.html
Tilt record for a station south of Shishaldin Volcano showing an event where lava disappeared from inside the volcano. The red and blue lines show the tilt in two directions that are at a 90-degree angle to each other. Since the instrument is installed in a borehole, these directions are often not aligned with the cardinal geographic directions. However, the plot at the bottom shows X-Y tilt in that reference system. Clearly, the huge jump in tilt is toward the volcano – consistent with depressurization of the conduit system as the magma withdrew. The little bit of noise around 2019-09-23/24 is likely due to wind at the surface. Figure: Ronni Grapenthin, AVO Deformation Monitoring at AVO
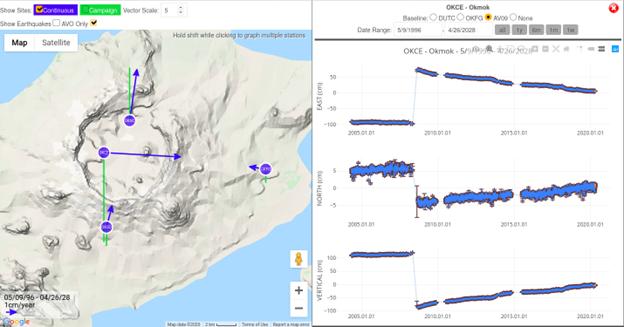
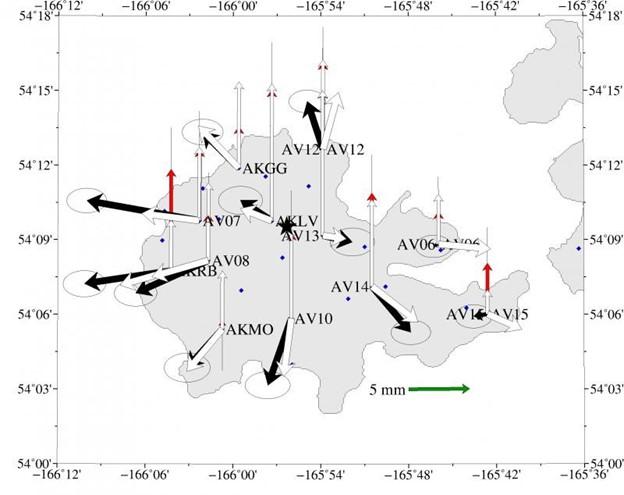
AVO operates networks of about 50 continuously recording GPS receivers at several Alaska volcanoes, such as the 4 shown for Okmok above. This means the instruments are permanently installed and the data are automatically sent to the lab for analysis. How many GPS we deploy on a certain volcano depends on many considerations, both scientifically and logistically. In many places we may not be able to find the solid bedrock that we like to install an instrument into, or the environmental conditions are so harsh that there is no hope for any instrumentation to survive. Ideally, several instruments are deployed at varying distances around a volcano such that we are able to determine location, geometry and volume change of magma chambers before, during and after eruptions. In addition to continuous GPS monitoring, AVO sometimes deploys GPS instruments at a volcano for a few days. If this is done again a year or two later, the difference in position of the benchmark gives useful information about how a volcano has behaved over the time interval. It is especially important to establish “baseline” campaign GPS measurements at potentially active volcanoes, so that when a volcano becomes restless, scientists have an accurate comparison point from a period of relative inactivity. AVO also uses InSAR (Interferometric Satellite Aperture Radar) data to detect and measure deformation at Alaska volcanoes. As mentioned above, this can be tricky given the often snowy conditions, and the steep terrain of Alaskan volcanoes. Furthermore, most of the deformation at Alaskan volcanoes is more subtle as the magmatic sources are often deep which means that the same volume increase results in a smaller maximum amplitude of deformation, but the deformation is spread out over a larger area. Since 2014, the European Space Agency begun to make the SAR data from their Sentinel 1A/B missions available for free. These satellite take radar images every 6-12 days and we routinely analyze the data at volcanoes that show signs of unrest. AVO currently operates tiltmeters on 3 volcanoes: Akutan, Westdahl and Shishaldin; these instruments are generally co-located with continuous GPS instruments for logistics reasons. Particularly during the 2019-2020 eruption at Shishaldin, the tiltmeters were exceptionally useful as this open vent volcano does not pressurize as much, and hence show enough deformation to manifest in GPS data – as closed vent volcanoes might.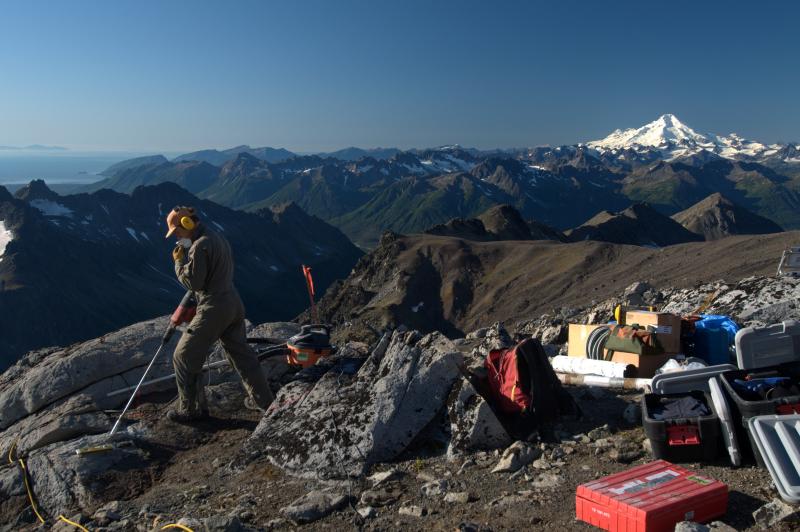
What are we doing with these data? We can use the observations of surface deformation and figure out where and how much magma may be accumulating or erupting. The figure below shows this as an example for the 2009 eruption of Redoubt Volcano. The top panels show the deformation recorded during the explosive phase of the eruption (left), the effusive phase at the tail end of the eruption (middle) and the total deformation between summer 2008 to summer 2009 (right), from before to after the eruption. The red and blue arrows are vertical (red) and horizontal (blue) motion of each GPS station. The white (horizontal) and black (vertical) arrows show the motion we would expect to see at these stations if magma was removed from the magmatic system below the volcano. From these data and how they change over time, we can come up with a model, shown in the bottom panel, of magma migrating through the system. Initially, we see a deep addition of magma, which warms up magma left over from the 1989 eruption of Redoubt. It is mostly that magma that we saw “disappear” with the GPS data. The petrology of the erupted material, however, states that it had resided at 2-4.5 km. Since that’s not what we see from the GPS data, we can say that the magma that moved up from 7-11.5 km replaced the shallow magma that erupted. Much like squeezing a tube of toothpaste!
