Volcanic Gas Monitoring of Alaska Volcanoes
Volcanic Gas Monitoring by AVO
Alaska is home to ∼40 persistently degassing volcanoes [1] . AVO scientists monitor degassing from Alaska volcanoes using a combination of direct sampling; in situ plume measurements; and ground-, air-, and satellite-based remote sensing.
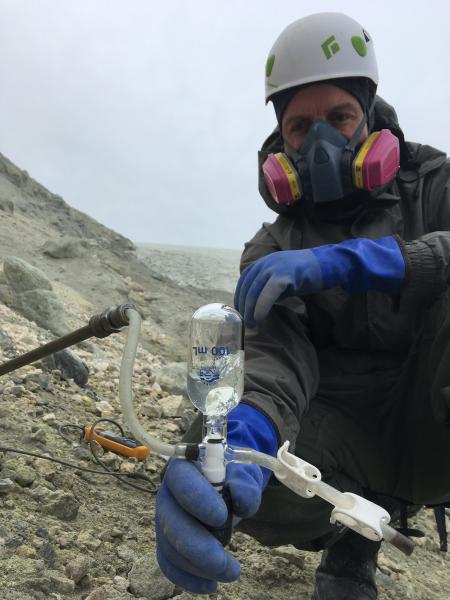
Direct sampling involves the collection of gases released from volcanic vents into sample bottles for analysis in a laboratory (Figures 1 and 2). These measurements allow determination of the total gas composition and can provide information on minor components in the gas that can't otherwise be measured. This type of information is helpful to detect chemical changes that may occur deep within the volcanic system. This monitoring method requires that conditions on the volcano are stable and safe for the scientists to remain on the ground for long periods of time.

Multi-GAS (Multiple component Gas Analyzer System) instruments are used to measure the abundances of the main gases within a volcanic plume (H2O, CO2, SO2, H2S) [2] . These instruments draw plume gases through a series of sensors using a small pump. These instruments are used extensively in Alaska during ground-based and airborne campaign measurements. Multi-GAS instruments can also be deployed in Alaska on a semi-permanent basis, to measure gas compositions continuously, but the harsh weather makes maintaining permanent stations very difficult.
Volcanic gases absorb ultraviolet and infrared radiation which makes measuring volcanic gases using remote sensing techniques possible. By measuring how much natural radiation is absorbed by these volcanic gases using remote sensing instruments, scientists are able to quantify the amount of volcanic gases released into the atmosphere. SO2 gas is readily measured by ultraviolet absorption, and AVO uses ground-based, airborne and satellite-based instruments to remotely quantify volcanic SO2 degassing from Alaska volcanoes.
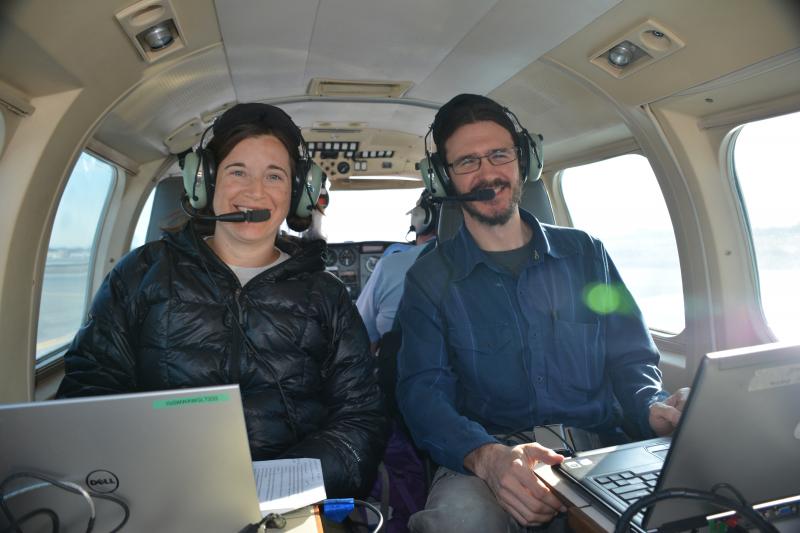
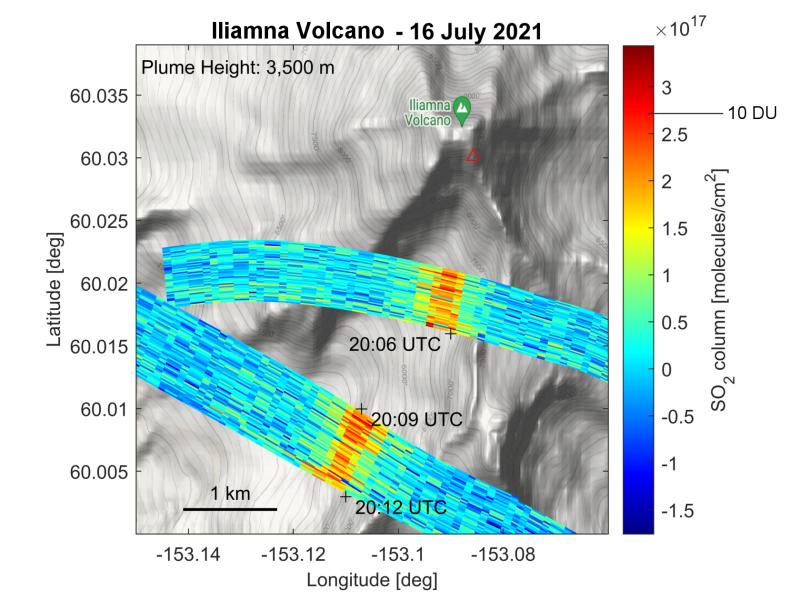
Airborne volcanic gas measurements are the primary way AVO measures volcanic gas emissions (e.g., Figure 3 [3] ). AVO scientists routinely conduct airborne surveys by airplane to measure volcanic gas emissions from volcanoes within Alaska's Cook Inlet and Katmai regions. An example image of SO2 detected from Iliamna Volcano during a 2021 airborne survey can be seen in Figure 4. AVO scientists also conduct airborne gas surveys at Alaska's more remote degassing volcanoes during helicopter-supported field campaigns.
Recently, the first permanent ground-based instruments for measuring SO2 emissions based on ultraviolet radiation absorption were installed on Mount Cleveland volcano (Figure 5). These two instruments now provide daily SO2 fluxes that can be used with complementary tools by AVO to monitor this active volcano.

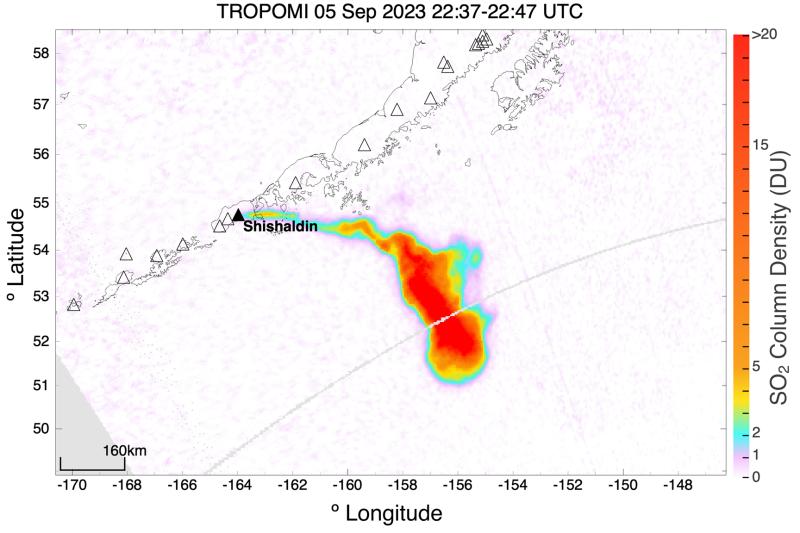
Satellite measurements are particularly important when the volcano is too remote or conditions are too dangerous to use ground-based or airborne techniques [4] [5] . Satellite data from the TROPospheric Monitoring Instrument (TROPOMI) sensor are now used operationally to monitor volcanic SO2 degassing from Alaska volcanoes. An example TROPOMI image showing SO2 emitted during an explosive eruption of Shishaldin Volcano can be seen in Figure 6.
Background on Volcanic Gas Monitoring
Changes in the quantity and/or composition of gases released from volcanoes are often one of the earliest indicators of volcanic unrest. Volcanic gases are dissolved in magma under the high-pressure conditions experienced deep within the Earth's crust. As magma ascends towards the surface pressure decreases the gases leave the magma (exsolve) to form a separate gas phase. Due to their lower density, gases can rise to Earth's surface ahead of the source magma, similar to CO2 bubbles rising through a glass of soda. In this manner volcanic gases can provide a signal of magma ascent, and thus changes in the amount and composition of emitted gases can be important eruption precursors (Figure 7).

Volcanic gases are composed primarily of H2O (water vapor), CO2 (carbon dioxide) and sulfur bearing gases SO2 (sulfur dioxide) and/or H2S (hydrogen sulfide), with lesser quantities of HCl (hydrogen chloride) and other trace gases [6] . Some gases are more easily dissolved in magma than others, such that as the magma rises the amount and type of gas that exsolves will change [7] . Emitted gases can therefore help scientists determine if a magma body is shallow or deep. Along with pressure, magma composition also affects how various gases exsolve. The Figure 8 animation depicts how gases would exsolve from a silica-rich magma.
Changes in the quantity of gases released with time, referred to as the gas flux or emission rate, can reflect changes in either the supply of magma (Figure 7) or how easily the gases are able to migrate through the volcanic conduit (Figure 9). For example an increase in gas flux may indicate an increase in magma supply, while a decrease in gas flux may indicate the sealing of the volcanic conduit. Both processes can lead to volcanic eruption.
The composition and flux of volcanic gases to the atmosphere can be modified by interactions with rocks and waters as the gases migrate to the surface. Certain volcanic gases, such as SO2 and HCl, are easily dissolved in water and can be removed or “scrubbed” from the gas phase. When this occurs, the main volcanic gases released to the atmosphere will be CO2 and H2S. Gas with abundant H2S is recognizable by the smell of rotten eggs. H2S is common at volcanoes that have active hydrothermal systems, where heated groundwater circulates in shallow levels of the crust during quiet periods between eruptions. The drying out of subsurface water, due to heating related to magma intrusion, can be recognized by an increase in the flux of SO2 to the atmosphere, and is an important indicator of volcanic unrest (Figure 10).
Case studies
Measurements of volcanic gases have been used by AVO to understand changes in volcanic activity at several of Alaska's restless volcanoes. We present three case studies that describe how gas composition and flux data were used to help forecast and monitor eruptive activity at Augustine, Redoubt, and Cleveland volcanoes.
Augustine Volcano 2006
Annual airborne surveys of gas emissions from Alaska's Cook Inlet volcanoes (Spurr, Redoubt, Iliamna and Augustine) began in 1990. These surveys were designed to establish baseline emission levels and identify signs of volcanic unrest. In the years leading up to the 2006 eruption of Augustine Volcano (Figure 11), concentrations of CO2 and SO2 in the plume were below detection limits. No measurements were collected in the months preceding the eruption. On December 20, 2005, approximately three weeks prior to the Jan 11, 2005 eruption, SO2 emissions reached 660 metric tons per day (t/d) [8] and six days prior to the large explosive eruption, SO2 emissions reached 6,700 t/d, indicating vigorous degassing of shallow magma. This was one of the first times when substantial changes in volcanic gas measurements preceded the eruption of an Alaska volcano, which highlighted the capability of this tool for volcano monitoring by AVO.

Redoubt Volcano 2009
In 2008, after almost twenty years of quiescence, Redoubt Volcano (Figure 12) began exhibiting signs of unrest. From October 2008 to March 2009, airborne surveys of Redoubt's plume measured elevated CO2 fluxes and CO2/SO2 ratios [9] [10] . These observations indicated ascent of a deep, CO2-rich magma, which helped AVO forecast the impending eruption on March 23, 2009 [9] [10] .

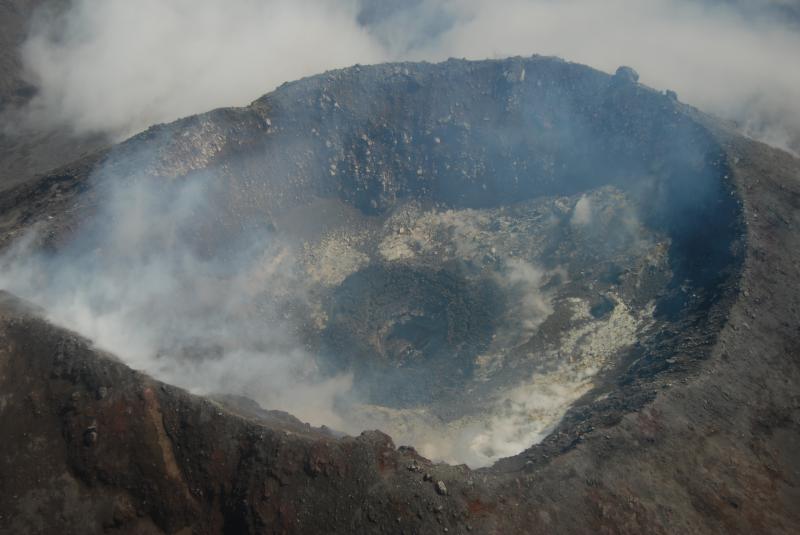
Mount Cleveland Volcano 2011-2015
Mount Cleveland volcano (Figure 13) is one of Alaska's most active, and until recently, least-studied volcanoes, due to its remote location. Field campaigns in 2015-2016 and more recently in 2020-2022 allowed direct observations of Cleveland's vent and degassing activity. AVO personnel used Multi-GAS and airborne remote sensing instruments to measure SO2 fluxes ranging from 400-860 t/d and low CO2/SO2 ratios during airborne gas surveys in 2015. These observations are consistent with degassing of shallow magma [11] . These data are used with satellite and visual observations of lava extrusion and explosions to infer that sealing of Cleveland's vent likely leads to its frequent yet small explosive eruptions [11] .
“Failed” Eruptions
Signals of volcanic unrest that do not lead to eruption are often referred to as “failed” eruptions. These events likely represent cases when magma ascends into the shallow crust but does not reach the surface and erupt. In a review of gas composition and flux measurements collected between 1989 and 2006 at six Cook Inlet volcanoes, Werner et al. [12] found that at these volcanoes CO2 fluxes >1500 t/d and SO2 fluxes >1000 t/d typically resulted in volcanic eruptions. These thresholds can be used to help AVO scientists estimate the likelihood of an impending eruption.