Seismology

What is seismic monitoring?

Often, magma rising towards the surface at a volcano causes background seismicity (earthquake activity) to increase over a period of months or weeks, as the magma interacts with, and displaces or breaks, the surrounding rock. Volcanic earthquakes are usually quite small, with magnitudes less than two. As the eruption nears, seismologists sometimes see a unique type of volcano seismic activity known as long-period seismicity, thought to be associated with degassing of the rising magma. Finally, as an explosive eruption begins, the stronger seismic signals generated by an explosive eruption can be detected. In Alaska, this permits accurate determination of the time of onset of an eruption, including overnight or during poor weather when visual observations are not possible. This is critical information for agencies concerned with the safe operation of aircraft both above and downwind of Alaska volcanoes, as volcanic ash is very harmful to jet engines.

Seismometers measure ground shaking. These vibrations can be caused by many different processes besides magma movement, including hydrothermal gas and fluid movement, tectonic earthquakes, avalanches, and even stormy winds and surf. To see examples of how signals from different phenomena may appear on seismic “webicorder” data, please visit: https://volcanoes.usgs.gov/vhp/seismic_signals.html and https://www.avo.alaska.edu/webicorders/

Seismic monitoring at AVO

AVO maintains networks of seismometers on select Alaska volcanoes to locate and detect the typically small earthquakes associated with volcanic processes. A typical seismic network consists of four or more seismometers installed close to the volcanic vent. Data is transmitted in real-time through digital telemetry to AVO’s facilities in Anchorage. Once received, the data is automatically processed and carefully reviewed by a seismologist.

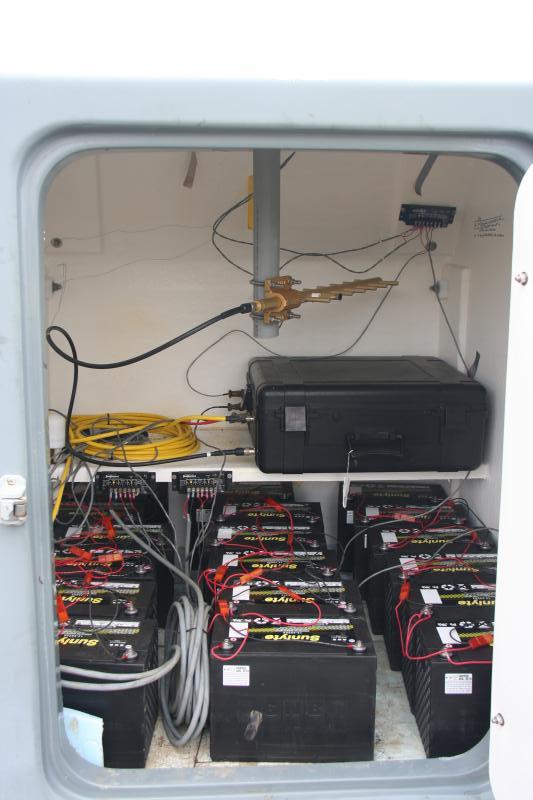
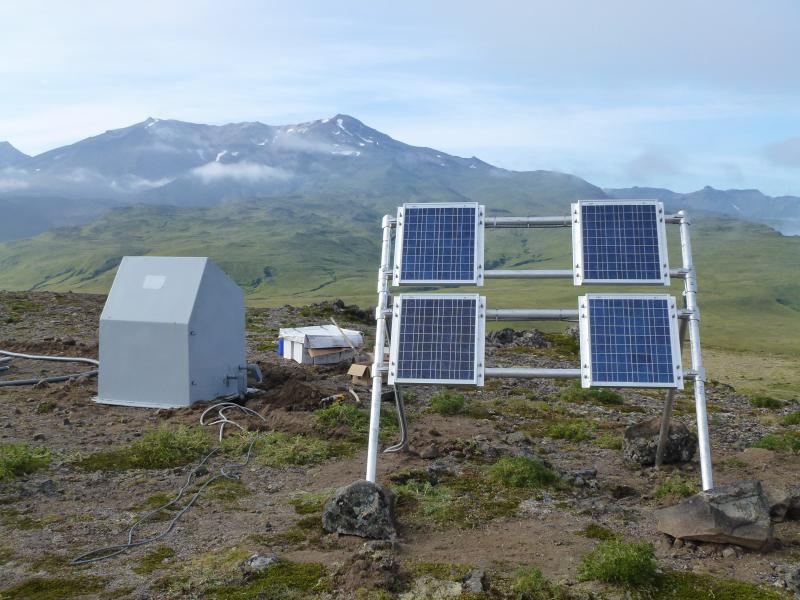
Seismometers are often co-located with other instruments, such as webcameras, GPS stations, and infrasound arrays. Because most Alaska volcanoes are remote, AVO’s seismic stations are typically equipped with a hut to shelter the electronics, marine batteries, and solar panels to power the instruments, and are designed to withstand Alaska’s harsh weather and creatures great and small.

View inside the hut at broadband station AKMO on Akutan. Batteries that supplement solar power rest on the hut floor. The electronics and radio sit inside the black masterbox, and the antenna is mounted inside the hut to protect it from the environment. Image courtesy of Helena Buurman, UAFGI/AVO, July 9, 2011.

Seismic station CLCO, Concord Point, Chuginadak Island. The peaks of  Tanax̂ Angunax̂ volcano are in the background. The solar panels on the swingset frame in foreground are part of the power system for CLCO and a webcam out of sight to the left. Photograph from fieldwork in the Islands of Four Mountains, John Lyons, USGS/AVO, August 1, 2014.
Seismic station CLCO, Concord Point, Chuginadak Island. The peaks of Tanax̂ Angunax̂ volcano are in the background. The solar panels on the swingset frame in foreground are part of the power system for CLCO and a webcam out of sight to the left. Photograph from fieldwork in the Islands of Four Mountains, John Lyons, USGS/AVO, August 1, 2014.

A small rockfall event occurred at Cleveland in July 2014, shown by the light-colored trail of dust rising above the path of volcanic debris that tumbled down the east flank of the volcano. The two panels below the photograph show how rockfalls are expressed in seismic data, as recorded by seismic station CLES at the southeast base of the volcano. On top is the seismic waveform - here spanning 1 minute and 30 seconds from left to right - showing the typical spindle-shaped, emerging and slowly diminishing ground shaking signal seen during rockfalls in many settings. Below that is the same information in the frequency domain: warmer colors show higher amounts of energy at different frequencies contained within the waveform. Rockfalls show a different mixture of high and low frequencies than earthquakes. Figure by John Lyons, USGS/AVO, July 29, 2014. For more on interpreting spectrograms, see: http://pnsn.org/spectrograms/faq .

Webicorder record for seismic station OKER on Umnak Island, showing explosive eruptions on December 28 and 29 (AKST), 2016, from Bogoslof volcano. Station OKER is 53 km (33 mi) south of Bogoslof Island and is located on the rim of Okmok caldera. The two Bogoslof eruptions show up as continuous seismic signals, each lasting about 40 minutes. Also seen on this figure are regional earthquakes, sensor calibration pulses, and a roughly 13-hour period of high wind. A 1-5 Hz filter has been applied to the seismic data in this image. Figure by Michelle Coombs, USGS/AVO.