Remote Sensing
What is Remote Sensing?
Remote sensing scientists at AVO use data collected by geostationary and polar orbiting satellites to monitor and analyze volcanoes in Alaska. These data can be used to detect several different types of volcanic activity, including elevated surface temperatures, gas and ash emissions, crustal deformation, and emplacement of lava flows or explosion craters.
Remote Sensing at AVO
In Alaska, a key use of remote sensing data is to monitor the position of ash plumes generated by explosive eruptions, as the plumes drift downwind from the volcano and are hazardous to aircraft. In recent years, eruption plumes from Alaska volcanoes have disrupted air traffic as far as the eastern seaboard of the United States, eastern Canada, and as far south as the Mexico-U.S. border. Thermal monitoring of the volcanoes (via satellite data) can also show the emplacement of lava flows or heating of a volcanic vent prior to eruption. Volcanic gas emissions are also detected in the atmosphere with satellite data. Visual observations made via webcams are also part of our remote sensing program. Webcam observations can confirm an eruption, show vapor or fumarolic activity, or show geomorphic change (like landslides). By combining these data with information from other monitoring techniques, AVO can better understand what is happening with a volcanic system, detect eruptions and significant unrest, and issue timely warnings to protect people and property.

Landsat-8 satellite image of Cleveland Volcano, draped over topography, collected shortly after midnight on July 23, 2015 (08:53 UTC; 12:53 am AKDT). The grayscale base image is from thermal infrared data, and shows temperatures from cool in white to warm in black. The color overlay is short-wave infrared data, and shows high temperature features that aren't seen in TIR data. A hot summit vent is observed (the red dot), surrounded by slightly cooler (but still hot) deposits likely from the explosion on 21 July. Note that steaming or clouds obscured a portion of the hot deposits on the south side, observed as an indent in the circular deposit. Figure by Dave Schneider, USGS/AVO, July 23, 2015.
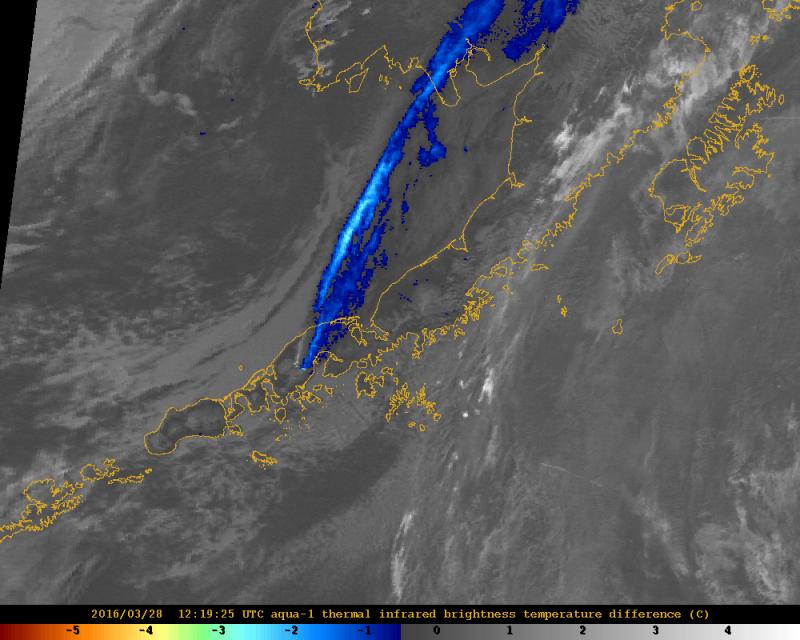
Satellite image showing strong ash signal (blue) extending more than 500 km (300 mi), north-northeast from Pavlof, 4:19 am AKDT (12:19 UTC), March 28, 2016. Figure by Michelle Coombs, USGS/AVO, March 29, 2016.