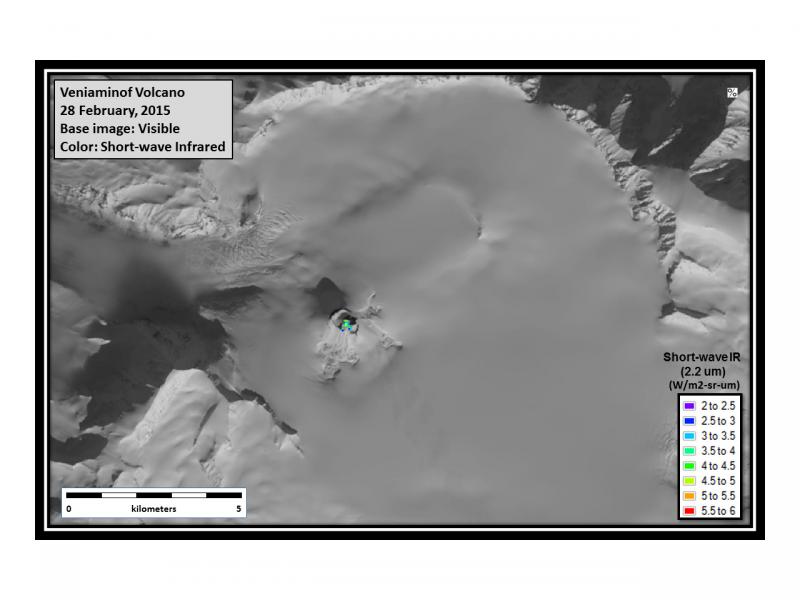
Composite Landsat-8 image of Veniaminof Volcano collected on February 28, 2015. The grey scale base image is from the 15-meter-resolution "Panchromatic" band that records visible light. Superimposed onto it (in color) are short-wave infrared data that are sensitive to high temperatures. These data show high surface temperatures, expressed as radiance values (a measure or thermal emission), confined to the summit crater of the intracaldera cone. These areas of elevated surface temperatures are typical for Veniaminof during non-eruptive periods. The surface expression of the lava flows produced during the 2013 eruption are seen as depressions in the snow cover on the south and east sides of the cone. A faint shadow from steam emissions can be seen over the summit icefield to the southeast of the cone, although the emissions themselves are not readily visible.
Volcano(es): Veniaminof
Photographer: Schneider, D. J.
URL: avo.alaska.edu/image/view/77321
Please cite the photographer and the Alaska Volcano Observatory / U.S. Geological Survey when using this image.
Full Resolution.