AVO Webicorders
AVO uses several different types of data to monitor volcanoes for signs of unrest or eruptive activity. The data displayed here have not been reviewed in any way, and are preliminary unless reviewed by an AVO geoscientist.
WHAT'S A WEBICORDER?

In the past, drum recorders were used to display seismograms on pieces of paper. As the drum revolves, the pen shifts across it, making a big spiral or helical record that eventually fills the entire page. When the paper is removed and laid flat, the record appears to be many horizontal lines, like lines in a book. These mechanical recorders have largely been replaced by computers, which digitize the data and store it in digital form. The digital data can then be displayed in a variety of ways by the computer. On this web page, we display seismic data to look like the old-fashioned paper records that drum recorders produced. We call these plots webicorders.
The webicorders displayed here are from seismograph stations at monitored volcanoes. The stations are part of the Alaska Volcano Observatory seismograph network. They show a record of ground velocity at the particular seismograph station for the past 24-hours.
Available Webicorders
HOW TO READ A WEBICORDER
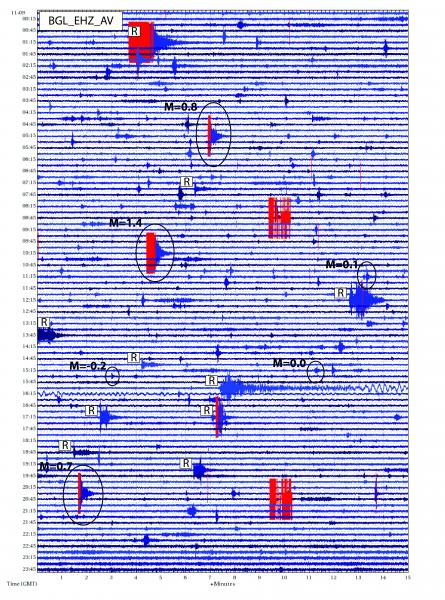
The webicorder is "read" like a book, from left to right and top to bottom (this is the direction that time increases). As with a book, the right end of any horizontal line "connects" with the left end of the line below it. Each line represents 20 minutes of data. We provide an annotated sample to assist you in interpreting the webicorders.
The vertical lines indicate equal intervals of time. Each vertical line is equal to one minute. Time is indicated at the left end of some of the lines of the plot in local Alaska time and at the right end in Universal time. The horizontal lines are colored in order to differentiate one line from the ones above and below it. When the amplitude of the signal is larger than a set value; the signal is colored red because the full amplitude would either cover much of the plot or the signal was larger than the dynamic range of the seismometer.
INTERPRETING WEBICORDERS
When an earthquake occurs the webicorder will show ground motions that vary in amplitude depending on the size of the earthquake and the sensitivity of the seismograph. The height of the recorded waves on the webicorder (wave amplitude) is a greatly magnified representation of the actual ground motion. The magnification is 50,000 times or more depending on the site. A recording of an earthquake has recognizable characteristics. Typically, one can recognize the arrival of different wave types: P (the primary, fastest traveling waves) and S (shear waves). Greater separation between P and S waves indicate increasing distance to the earthquake.
On these seismograms you may see a variety of signals. Examples of signals seen on the webcorders are local earthquakes, volcanic tremor at Alaska's volcanoes, and earthquakes elsewhere in the world. Almost any earthquake in the world having a magnitude greater than 5.5 will be seen on these webicorders.
Not all the wiggles seen on the seismograms are due to earthquakes. Anything that shakes the ground could be recorded. For example rockfalls, icequakes in glaciers, and ground motion induced by high wind conditions and ocean waves are very common at Alaska's volcanoes. Even a bear lumbering by will produce a signal. Electrical noise may also appear on the seismogram. Such noise is usually easy to distinguish from earthquake generated signals because the noise is often "spikey" in appearance. In addition, all stations have calibration pulses once every 12 hours. These will always be in red or clipped.
EXAMPLES