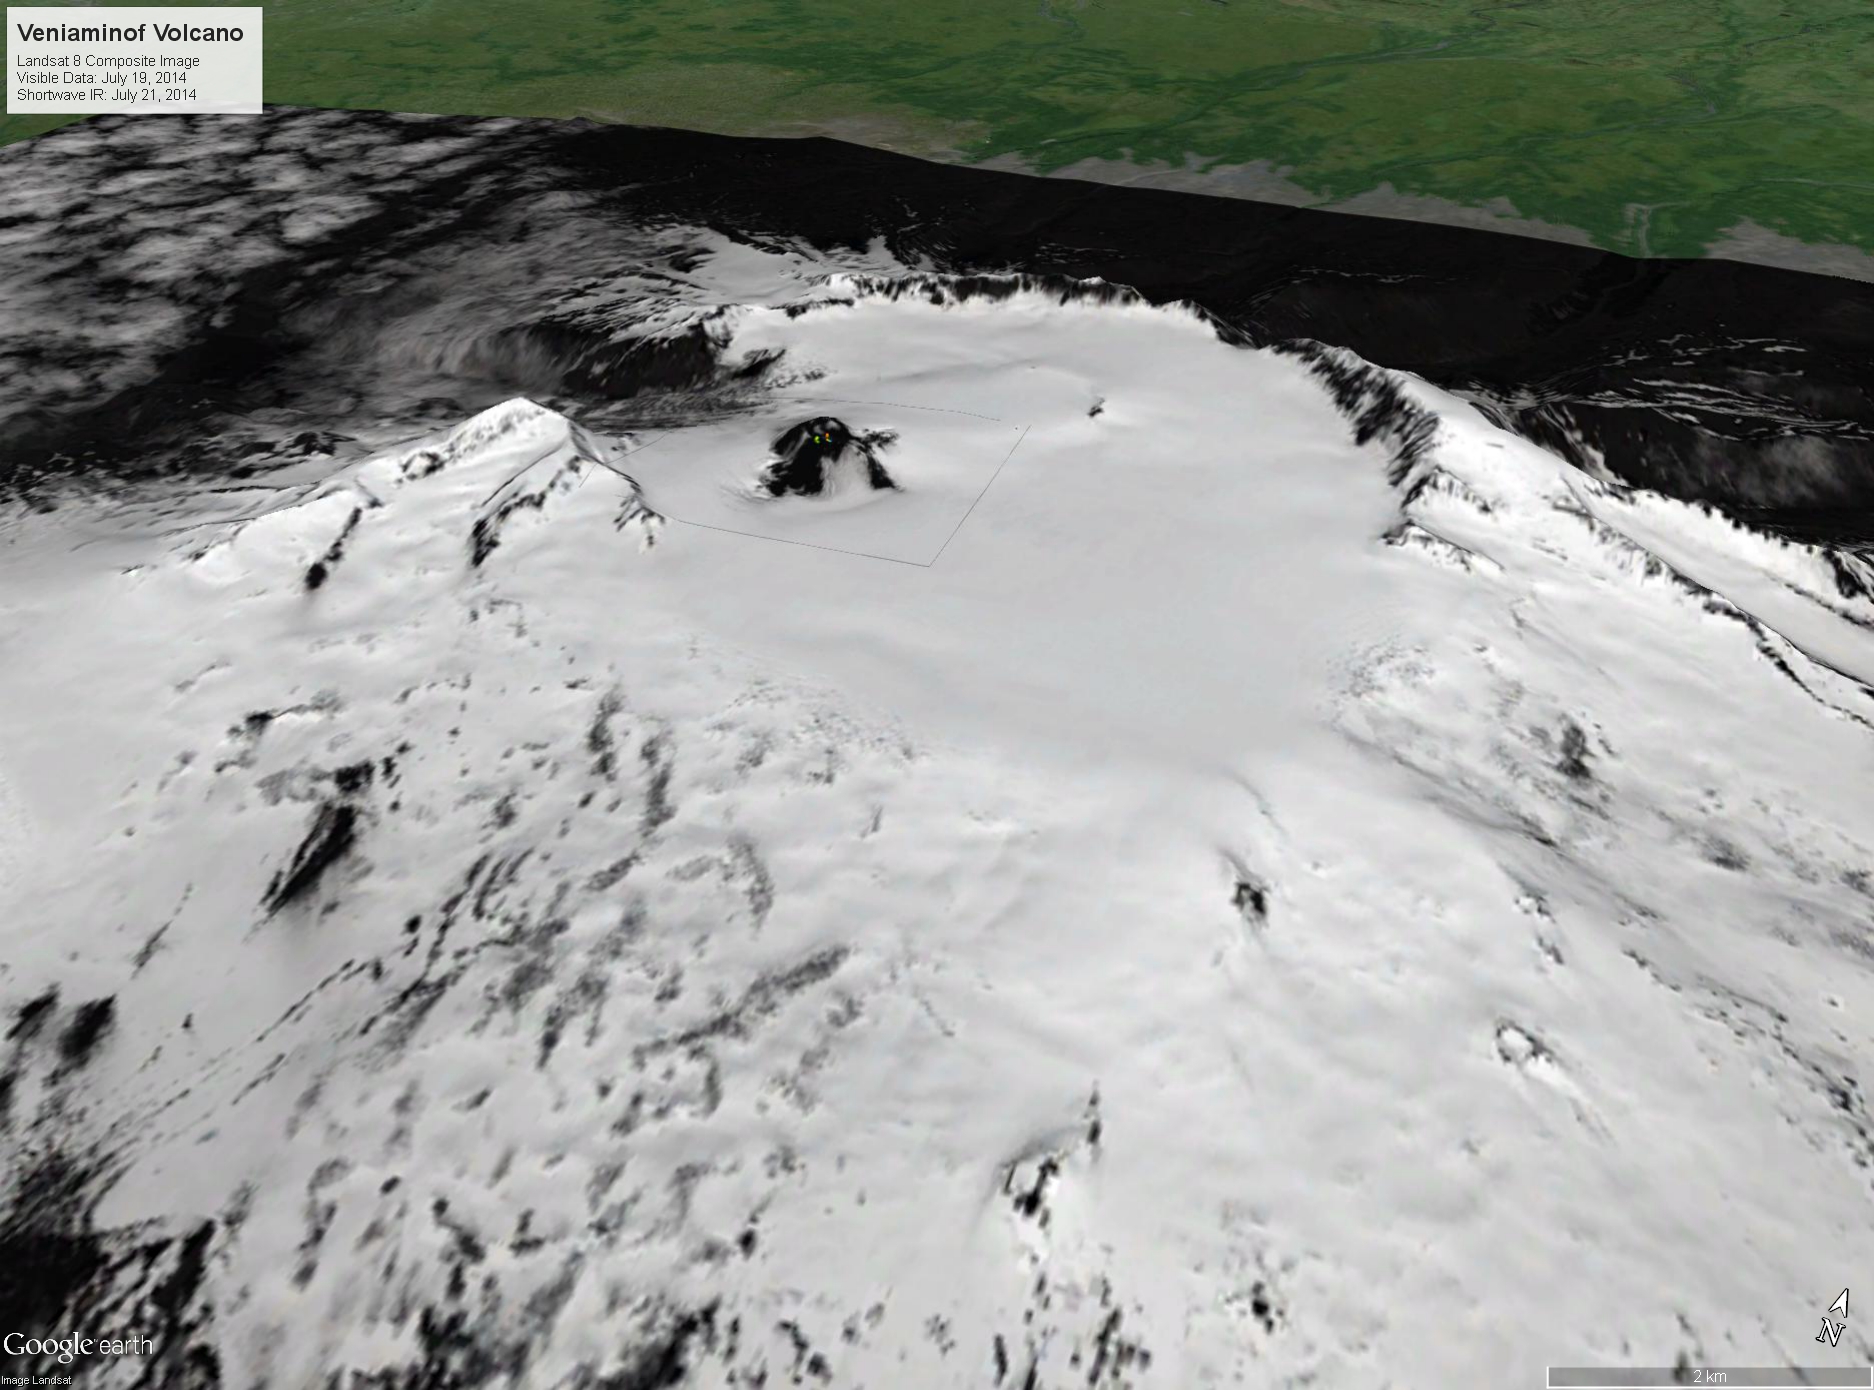
A composite Landsat-8 image made by combining daytime visible wavelength data from July 19, 2014 with nighttime shortwave infrared (SWIR) data from July 21. This viewing perspective is from the southeast, and shows several small areas of enhanced SWIR emissions (the small colored squares) on the top of the intracaldera cone. The SWIR data are sensitive to high temperatures (hundreds of degrees Celsius) and highlight the persistently hot regions of the cone. Note that this is not eruptive activity, but rather a hot vent or cracks in the cone. The hot features are seen routinely in nighttime SWIR satellite images over the past months.
Date: Jul 21st, 2014
Volcano(es): Veniaminof
Photographer: Schneider, D. J.
URL: avo.alaska.edu/image/view/66651
Image courtesy of AVO/USGS.Volcano(es): Veniaminof
Photographer: Schneider, D. J.
URL: avo.alaska.edu/image/view/66651
Please cite the photographer and the Alaska Volcano Observatory / U.S. Geological Survey when using this image.
Full Resolution.